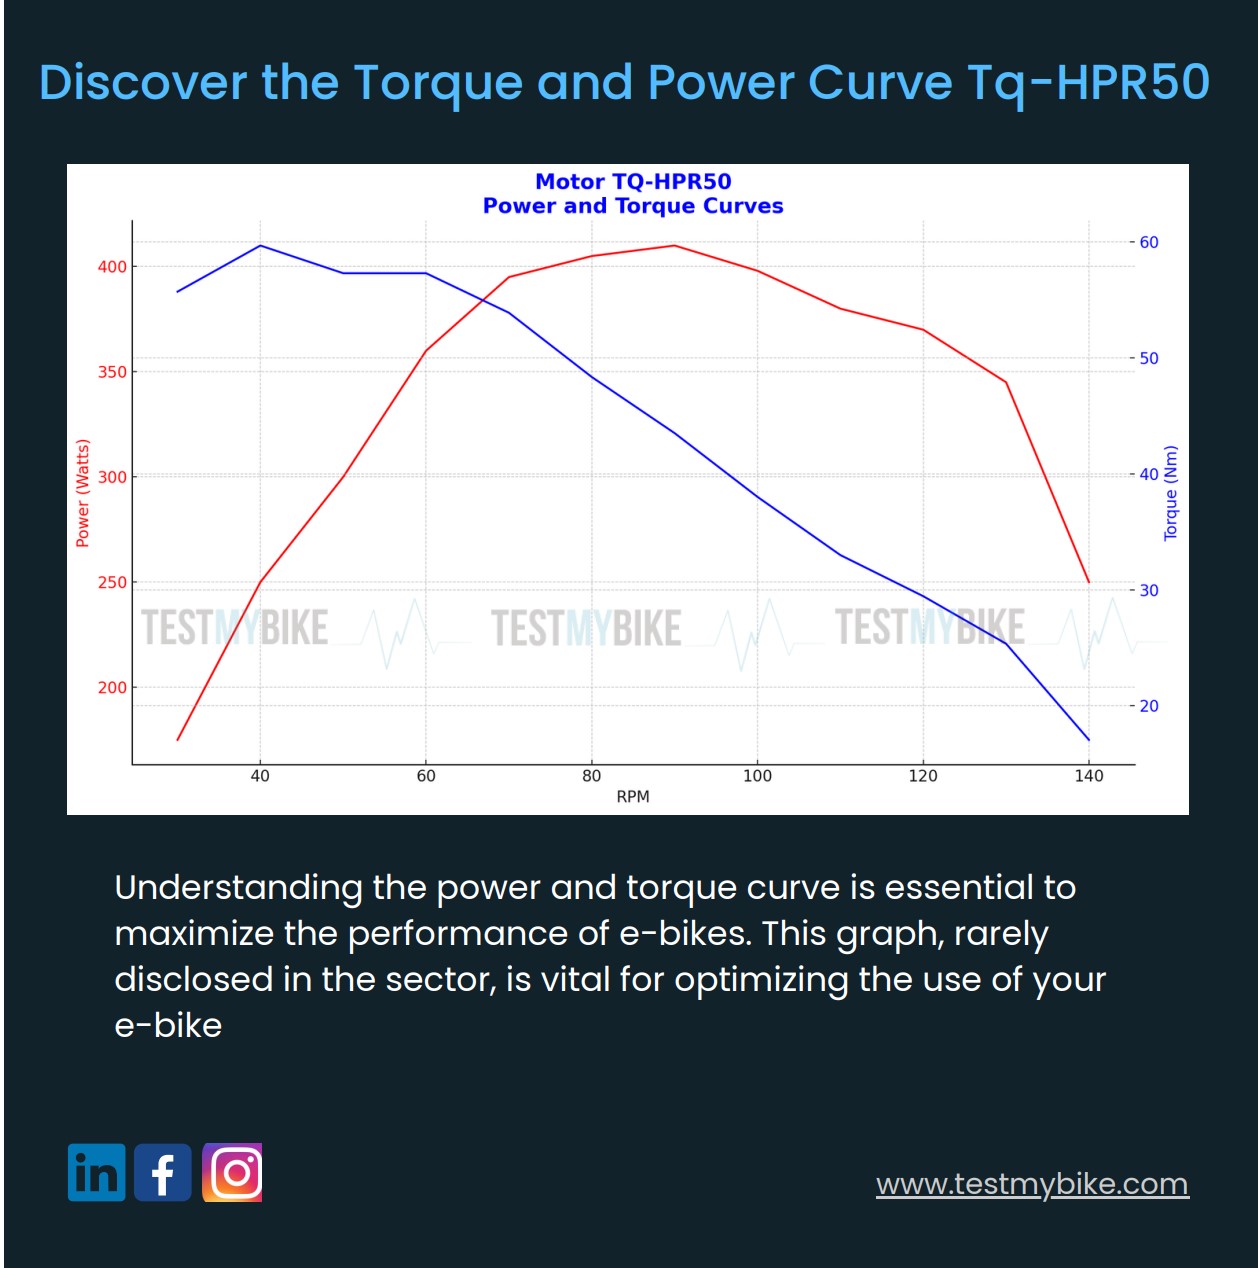
Understanding power and torque curves is essential for evaluating the performance of an engine, like the TQ-HPR50, especially in the context of lightweight and sporty bicycles known as Sl. Below, we detail how to interpret this graph and what information it provides us:
🔋 Power (Watts) The power, represented by the red curve, indicates the rate at which the motor does work. It is the product of torque and angular velocity (RPM). A power curve that increases with RPM and then falls shows the motor's optimal operating range. In sporty bicycles, this translates into knowing when the motor is delivering its maximum performance and when it begins to decline.
🔧 Torque (Nm) The torque, shown by the blue curve, is the force that the motor generates to move the bicycle. High torque at low RPM means that the bicycle can start quickly and climb hills with ease. The curve shows us how the torque initially remains constant and then decreases, which is vital to understand how the bicycle will behave in different situations.
🔄 RPM (Revolutions per Minute) The RPM indicates the speed at which the motor is spinning. By analyzing how the power and torque curves behave in relation to the RPM, we can identify at what speed the motor operates optimally. That is, we can determine at which point the motor provides the best combination of strength and speed without wasting energy, which is an indication of its efficiency.
📈 Graphical Interpretation Reading the graph involves observing how the power and torque curves intersect and evolve with the RPM. This interaction helps us to optimize the motor for different cycling styles, ensuring that the motor delivers the appropriate power and torque throughout the complete pedaling cycle.