As we have explored in previous articles, in the world of electric bicycles, the efficiency of a motor is not just a technical detail, but a crucial factor that defines the range of our bicycles. At TestMyBike, we dive once again into this topic, this time to test two of the most outstanding motors in the market: the TQ HPR50 and Fazua Ride 60 motors.
What isBefore diving into the data, we believe it is essential to understand what efficiency means in the context we are going to address. The efficiency of an electric motor is measured by its ability to convert electrical power (the energy consumed) into mechanical power (the energy used to move the bicycle). Essentially, a more efficient motor better utilizes the electrical energy it consumes, transforming it into a greater proportion of useful energy for the cyclist.Efficiency? Electrical Power vs. Mechanical Power
Antes de sumergirnos en los datos, creemos que es fundamental comprender qué significa la eficiencia en el contexto que la vamos a abordar. La eficiencia de un motor eléctrico se mide por su capacidad de convertir la potencia eléctrica (la energía consumida) en potencia mecánica (la energía utilizada para mover la bicicleta). En esencia, un motor más eficiente utiliza mejor la energía eléctrica que consume, transformándola en una mayor proporción de energía útil para el ciclista.
A Reliable Method: The TMB Method
Our unique approach, the TMB method, ensures that the conditions of the test are replicated precisely for each motor. This internal standardization allows us to present results that can be confidently compared.
Boost Mode: Increased Power with Fazua Ride 60
When making this comparison, we know that the Fazua Ride 60 motor offers an interesting boost (turbo) mode that can reach around 600 electrical watts for 12 seconds, thus providing a significant increase in power at key moments. For this analysis, however, we have chosen to exclude this feature from the test in order to maintain an equitable comparison with the TQ HPR50 motor, focusing on the usual power ranges. Nevertheless, it is important to point out that in future reports we will reveal how this mode affects the efficiency of the Fazua Ride 60 motor, including its performance in this higher power spectrum.
Efficiency in the Spotlight
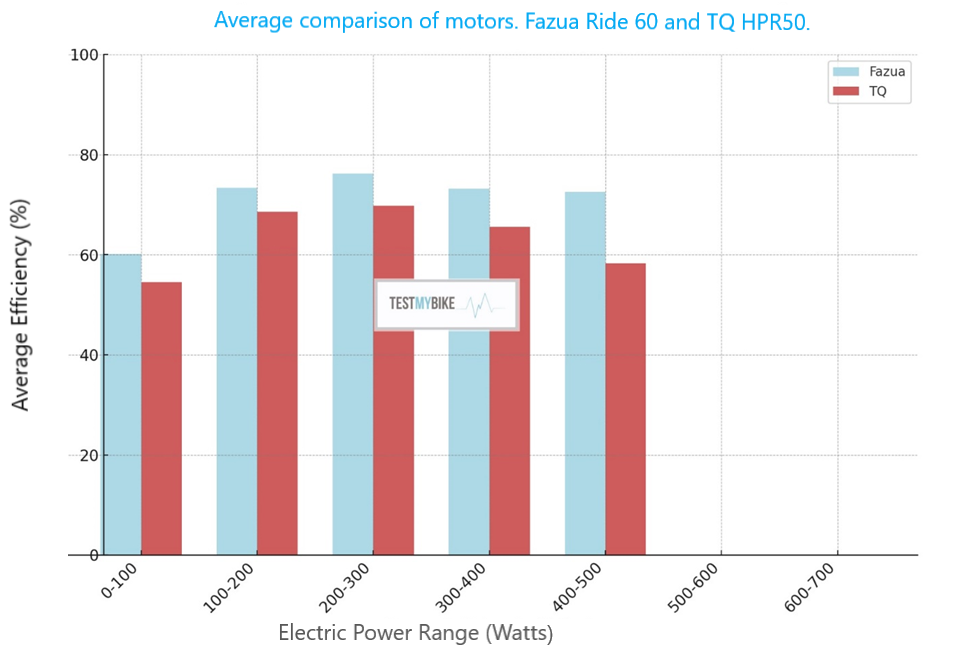
Our study presents a clear picture where the average efficiency, expressed in percentages, is shown on the Y-axis, while on the horizontal X-axis the ranges of electrical power are displayed from 100 watts to 100 watts. The data reveal that the Fazua Ride 60 motor consistently outperforms the TQ HPR50 in terms of efficiency with an advantage ranging from 6.88% in the 100-200 watts range to 24.37% in the 400-500 watts range.24.37% en el rango de 400-500 vatios.
Motor Efficiency Table:
| Rango de W | FAZUA RIDE 60 (%) | TQ HPR50 (%) | Difference | Direct Percentage (%) |
| 0-100 W | 60.15% | 54.51% | 5.64 | 10.35% |
| 100-200 W | 73.34% | 68.62% | 4.72 | 6.88% |
| 200-300 W | 76.01% | 69.78% | 6.23 | 8.93% |
| 300-400 W | 73.20% | 65.52% | 7.68 | 11.72% |
| 400-500 W | 72.52% | 58.31% | 14.21 | 24.37% |
Clarifying Concepts: Difference by Percentage Points vs. Relative Percentage Difference
It is essential to understand the distinction between the 'difference in percentage points' and the 'relative percentage difference', as each offers a different perspective on the same data.
Difference by Percentage PointsThis term refers to the absolute difference between two percentages. For example, if the Fazua Ride 60 motor has an efficiency of 72.52% in the 400-500 watt range and the TQ HPR50 motor has an efficiency of 58.31%, the difference in percentage points is 14.21. This is simply obtained by subtracting the two percentages (72.52% – 58.31% = 14.21).
Relative Percentage DifferenceThis calculation tells us how large the difference is in relation to the benchmark, in this case, the efficiency of the TQ HPR50 motor. Taking the same example, the Fazua motor is 24.37% more efficient than the TQ HPR50 motor. This is calculated by taking the difference in percentage points (14.21%) and dividing it by the efficiency of the TQ HPR50 motor (58.31%), and then multiplying by 100 to get the percentage (14.21 / 58.31 * 100 ≈ 24.37%). You can think of this as the percentage of improvement or increase in relation to the original starting point.
At TestMyBike, we provide this clarification because we believe it is fundamental that readers understand not only the magnitude of the difference between the motors, but also the meaning of that difference. By explaining how these percentages are calculated and compared, we enable our readers to have a deeper understanding of the relative efficiency of the motors and allow them to make informed decisions based on the relevance of the data, beyond the absolute figures.
Conclusions and Perspectives
With this analysis, we not only highlight the efficiency of these two motors, but also emphasize the importance of comparing data on a level playing field. Standardization is essential for a rapidly advancing industry, and at TestMyBike, we are committed to providing fair and transparent evaluations that our readers can rely on.